materials-chemistry/ai produced the result/Nature Communications 2020 · v2
A learning algorithm ran a synchrotron beamline to find a phase-change material
Researchers let a Bayesian active-learning system called CAMEO choose which germanium–antimony–tellurium compositions to measure by X-ray diffraction. Over 19 cycles it mapped the material's phases and picked out a composition averaging Ge4Sb6Te7.
spectrum · one line per step, placed by what the step does · bright lines used AI
On-the-fly closed-loop materials discovery via Bayesian active learning
Nature Communications, 2020
doi:10.1038/s41467-020-19597-w · record aix-00011 v2 · checked 2026-10-07
- AI was for
- Experimental design, Property prediction, Classification
- Model family
- Gaussian process, Probabilistic graphical model, Clustering
- Checked by
- Experimental
- Code
- available
The finding the paper is about came from the AI.
What this research was about
Mix three elements in different proportions and you get a different material at every ratio. Some ratios form one crystal structure, others form another, and the boundaries between those regions make up a phase diagram. Working out that map is slow, because each composition must usually be measured by firing X-rays at it and reading the pattern that scatters back. Phase-change materials are useful here: they can be flipped between a disordered amorphous state and an ordered crystalline one, and the two states absorb light differently. The size of that difference, measured as a gap in energy called the optical bandgap, is what makes such a material useful for switching light on and off.
The researchers made a thin film in which composition varied gradually across a wafer, divided into 177 spots, and set out to find the composition where the bandgap difference between the amorphous and crystalline states was largest. Measuring every spot would have taken over 90 hours of beam time.
Where AI came in
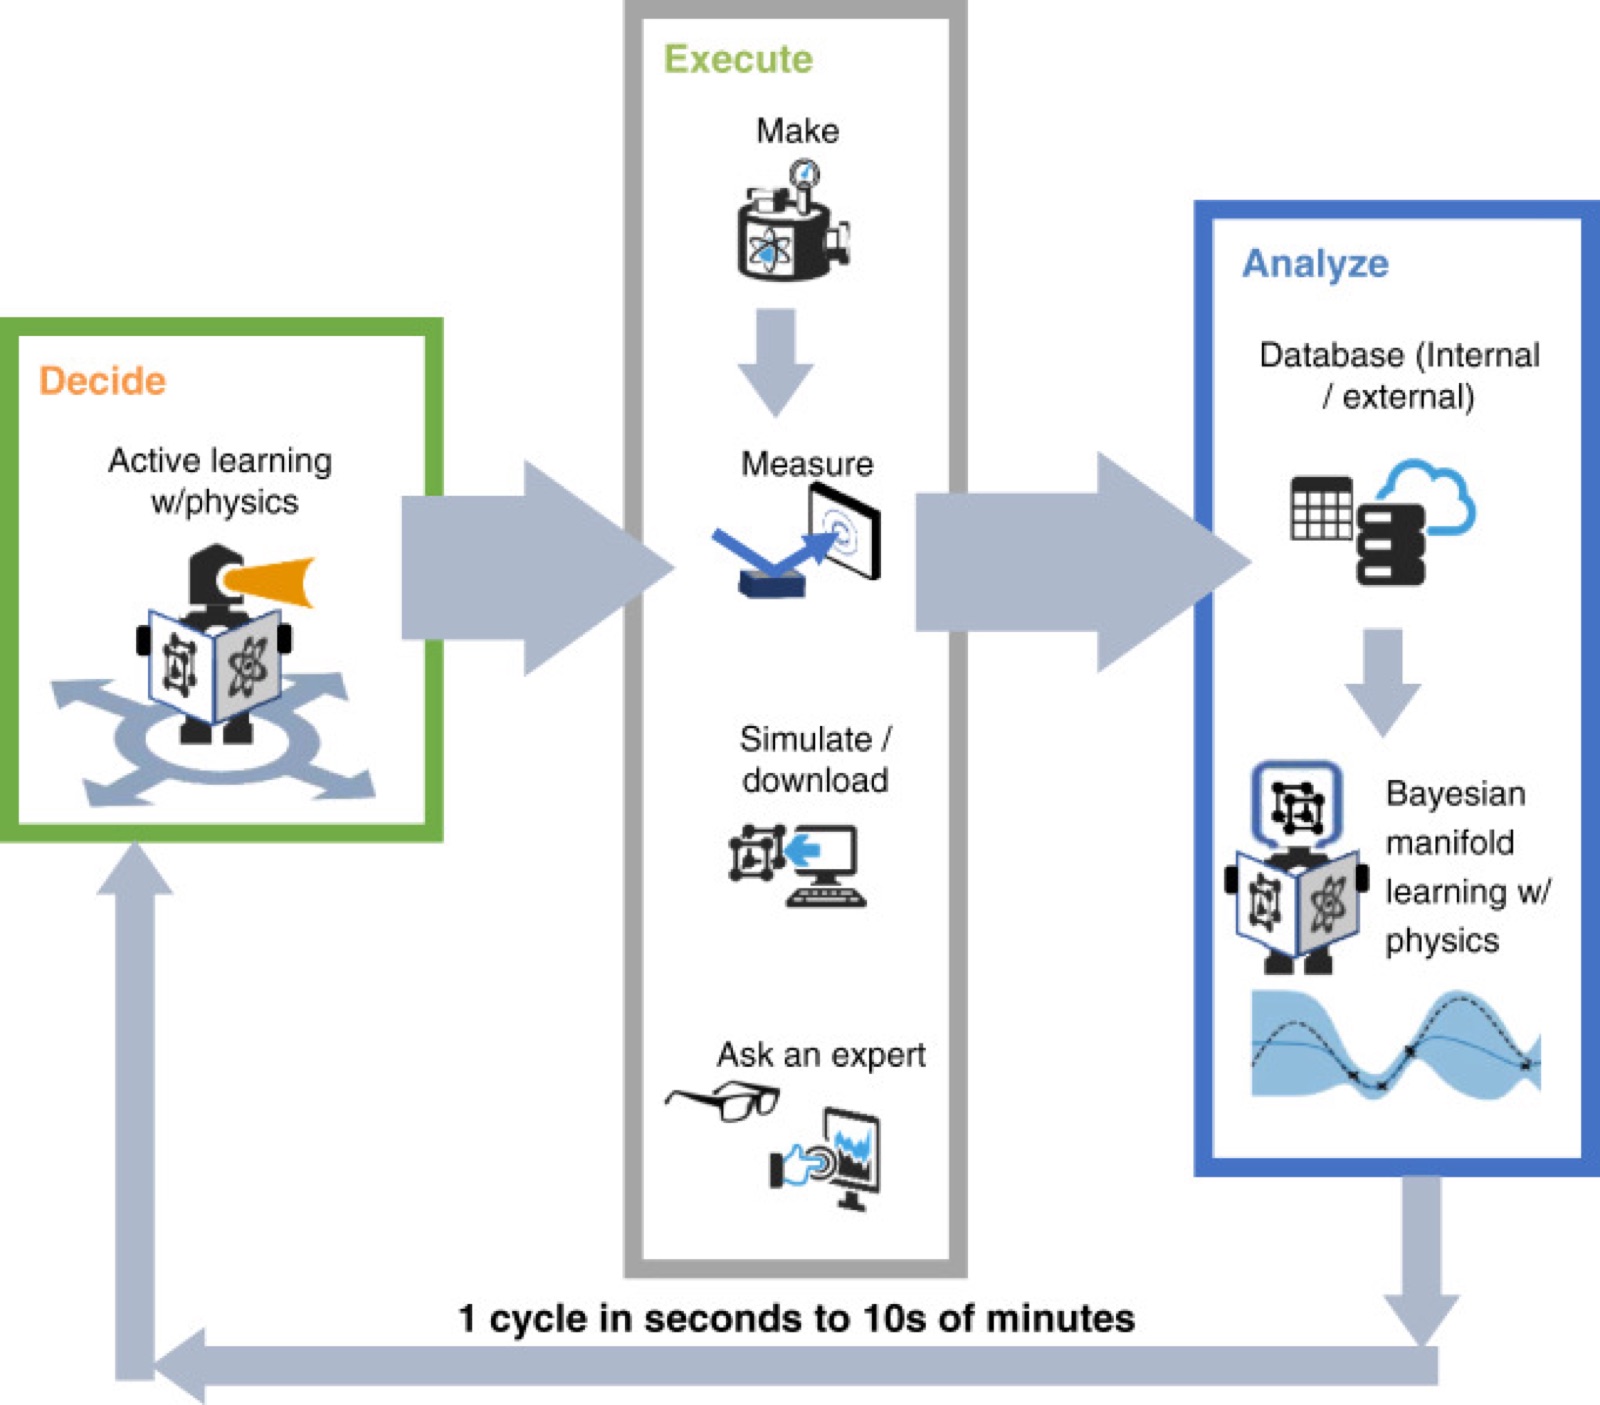
Rather than measure every spot, the team put a closed loop in charge. After each X-ray measurement, a graph-based model called GRENDEL sorted the patterns measured so far into phase regions, using physical rules about which mixtures of phases can coexist. A second method then spread those labels and property estimates across the compositions not yet measured, so the system always held a best guess for the whole wafer. Gaussian process regression, a technique that predicts a value along with how uncertain it is, was fitted to each phase region. The loop then chose the next composition to measure, controlling the synchrotron beam directly, and a human expert fitted the optical data to return the bandgap difference.
The decision the models stood in for is the one a scientist usually makes between measurements: which sample to try next, and when the map is good enough to start hunting for the best material. The reported run took about 10 hours over 19 iterations, and the composition it settled on, averaging Ge4Sb6Te7, had a bandgap difference of 0.76 ± 0.03 eV, against 0.23 ± 0.03 eV for the widely used Ge2Sb2Te5. The scheme was also compared afterwards with simpler sampling strategies.
Written by AIxSci from the checked record below, to give context for readers outside the field. It is not part of the record.
The work
Technical · from the record
CAMEO is a closed-loop active-learning system that took real-time control of high-throughput X-ray diffraction at a synchrotron beamline to map structural phases of a Ge–Sb–Te composition spread and search it for a phase-change material with the largest difference in optical bandgap between amorphous and crystalline states. A graph-based Bayesian phase-mapping model, label propagation to unmeasured compositions, and per-phase-region Gaussian process regression chose each next composition to measure, while a human expert fitted the raw ellipsometry data to return the bandgap difference for that composition. The run identified a composition at a phase boundary, averaging Ge4Sb6Te7, over 19 iterations taking approximately 10 h, compared with over 90 h to measure all 177 composition spots; its ΔEg was 0.76 ± 0.03 eV against 0.23 ± 0.03 eV for Ge2Sb2Te5. Electron microscopy of this composition showed a coherent nanocomposite of GST and Sb–Te phases, and photonic switching devices made from it were stable over at least 30,000 cycles.
How AI was used
Raw ellipsometric spectra collected before the run were reduced to pairwise similarity weights that modified the edges of a composition graph, supplying a prior for phase mapping. At each cycle the measured diffraction patterns were segmented into phase regions using GRENDEL, a Markov-random-field, graph-based phase-region and constituent-phase identification method that encodes physical constraints such as the Gibbs phase rule. Gaussian random field harmonic energy minimization, a semi-supervised method, propagated phase-region labels and their likelihoods to compositions not yet measured, and Gaussian process regression propagated the functional property. Phase-mapping measurements were chosen by risk minimisation over the resulting hypothesis space of phase maps until the Fowlkes–Mallows index between iterations reached 80% convergence, after which a separate Gaussian process was fitted to each phase region, the top-ranked region selected, and the next composition chosen by an upper-confidence-bound acquisition function with an added term weighting distance from the phase boundary. Each selected composition was then measured by synchrotron diffraction under programmatic instrument control and passed to a human expert who fitted Drude and Tauc–Lorentz models to the raw ellipsometry data and returned the bandgap difference to the loop. The scheme was compared post hoc against GP-UCB and random sampling over 100 simulated runs, and hyperparameters had been tuned beforehand on a previously characterised Fe–Ga–Pd spread.
The shape of the work
Structural · the record, drawn
no AI
Fabricate composition spread and collect ellipsometry spectra
Physical execution, by hand or by robot.
Amorphous thin-film composition spreads encompassing a region of the Ge–Sb–Te ternary (separated into 177 samples using a gridded physical shadow mask) were fabricatedwhere the paper describes this · verbatim
no AI
Build phase-mapping graph prior from raw ellipsometry spectra
Encoding data into features, descriptors, embeddings or graphs.
the raw ellipsometric spectra data were incorporated as a phase-mapping priorwhere the paper describes this · verbatim
no AI
Measure queried sample by X-ray diffraction under algorithm control
Physical execution, by hand or by robot.
CAMEO remotely controls scanning of the synchrotron beam to collect X-ray diffraction data from the spread waferwhere the paper describes this · verbatim
AI
Segment measured materials into phase regions
Running a trained model over new data to predict, classify or score. The AI stood in for manual curation.
Phase mapping was performed using the physics-informed phase region and constituent phase identification method GRENDELwhere the paper describes this · verbatim
AI
Propagate phase labels and property estimates to unmeasured materials
Running a trained model over new data to predict, classify or score. The AI stood in for physical experiment.
the semi-supervised learning technique Gaussian random field harmonic energy minimization (HEM) is usedwhere the paper describes this · verbatim
no AI
Expert extracts optical bandgap difference for the queried material
Cleaning, filtering, normalising or labelling data already obtained.
the query material was indicated to the experimentalist (human-in-the-loop) who then performed the intensive task of processing the raw optical data to obtain ΔEgwhere the paper describes this · verbatim
AI
Select the next material to measure and the optimum to pursue
Iterative search over a space. The AI stood in for expert judgement. Its result feeds back into an earlier step.
The phase regions are then ranked by the maximum expected functional property value and the top R regions are selected for optimizationwhere the paper describes this · verbatim
no AI
Verify phase map and characterise the identified composition and device
Testing outputs against ground truth.
Photonic switching devices were fabricated out of GST467 filmswhere the paper describes this · verbatim
What the record says
Technical · every part carries its own basis
+ in the paper~ our reading− not reported
How to read the quotations. A quotation shows where the paper describes something. It does not quote every value beside it: one passage locates a part of the work, and values without their own quotation are our reading of that passage.
The active-learning system chose every diffraction measurement and the composition reported as the discovery; the result the paper is about (identification of the Ge4Sb6Te7 region) came out of the model-driven loop rather than being merely analysed by it.
A separate Gaussian Process is fit to each individual phase region for the functional propertywhere the paper describes this · verbatim
to verify the accuracy of the phase diagram determined by CAMEOwhere the paper describes this · verbatim
The code can be found at the following github repository or using the following DOI linkwhere the paper describes this · verbatim
What this paper did not report
Technical · absence is published deliberately
- Trained model weightsWhether the trained model is available is not stated.
- How many were testedThe paper gives no count of what was tested.
- Version of GRENDEL (graph-based endmember extraction and labeling, Markov random field phase mapping)Which version of the model was used is not stated.
- Version of Gaussian random field harmonic energy minimization (HEM) label propagationWhich version of the model was used is not stated.
- Version of Gaussian process regression (MATLAB fitrgp)Which version of the model was used is not stated.
- Version of Gaussian process upper confidence bounds (GP-UCB) baselineWhich version of the model was used is not stated.
About this article
Record aix-00011, version 2, checked by a person on 2026-10-07. The record describes the paper; it does not assess whether the paper's findings are right. The paper is published under CC-BY-4.0; quotations are at most 25 words. How we work · Report an error